Data Analysis Software
Introducing our new post-test Data Analysis software, tailored to enhance your research.
The Data Analysis software is fully compatible with all CellScale systems, ensuring a seamless experience across your testing platforms. Photo and video data features, including non-contact strain measurement, are available with the UniVert, BioTester, and MicroTester systems.
Key Features
- Easily manage and review multiple tests through user-friendly tabs
- Automatically graph metrics, including stress and strain, offering comprehensive insights at a glance
- Faster computing power for non-contact strain measurement from DIC data
- Calculate material properties, including Young’s modulus
- Compile and share your data easily, in videos and CSV format

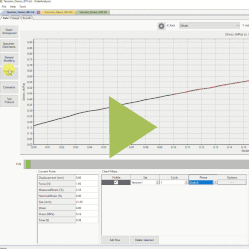
Visualize, Compare, and Customize Your Data
With Data Analysis, researchers can explore every aspect of their test results with precision and flexibility. The software allows multiple tests to be opened and compared side-by-side, using customizable graphs, filters, and curve fits to uncover key trends. Timeline markers let users track how their samples respond over time, while flexible data tab layouts make it easy to focus on specific phases or repeat sets. Whether adjusting graph axes, scaling parameters, or applying curve fits, Data Analysis gives researchers full control to interpret and present their results with clarity.
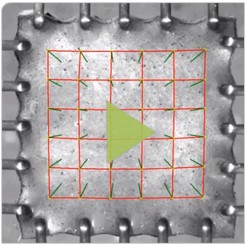
Advanced Imaging for Meaningful Insights
Data Analysis transforms images into powerful datasets. For systems equipped with scientific cameras (like the UniVert, BioTester, and MicroTester) researchers can visualize deformations, track features, and create full-field strain maps that reveal localized behaviour under stress. The program allows synchronized imaging, while playback tools, motion tracking, and edge detection functions help quantify real-time changes in shape or structure. Movies can even be exported with overlays and data visualization, helping researchers communicate findings visually and effectively.

From Raw Data to Material Properties
Beyond visualization, Data Analysis delivers quantitative answers. The material modelling and results tools guide users through calculating properties such as elastic (Young’s) modulus, drawing from either displacement or image-based strain data. Researchers can generate multiple curve fits, compare results across tests, use our break detection feature, and export comprehensive summaries in just a few clicks. The ability to combine data-driven analysis with visual tracking means researchers not only see how their specimens respond, but also understand why they respond that way.

Videos
Test Review and Analysis Demonstration

Uniaxial Test of Porcine Annulus Fibrosis
BioTester Image Tracking Example

Biaxial Test of Electrospun Polymer
DOWNLOADS
If you would like help with updating your device software, please contact the CellScale team for free support.