Researchers are getting better at estimating tissue mechanics without cutting, stretching, or directly compressing the tissue being studied. Optical coherence elastography is one example. It uses optical coherence tomography to track wave motion through tissue, then works backward from that motion to estimate mechanical behaviour.
That kind of approach is especially interesting for layered tissues such as skin, where stiffness can change over very small depths. But AI-based elastography measurements still need something physical to compare against. Without a mechanical reference, it can be difficult to know whether an imaging-derived stiffness estimate is actually tracking the material behaviour of the sample, or just producing a plausible-looking output.
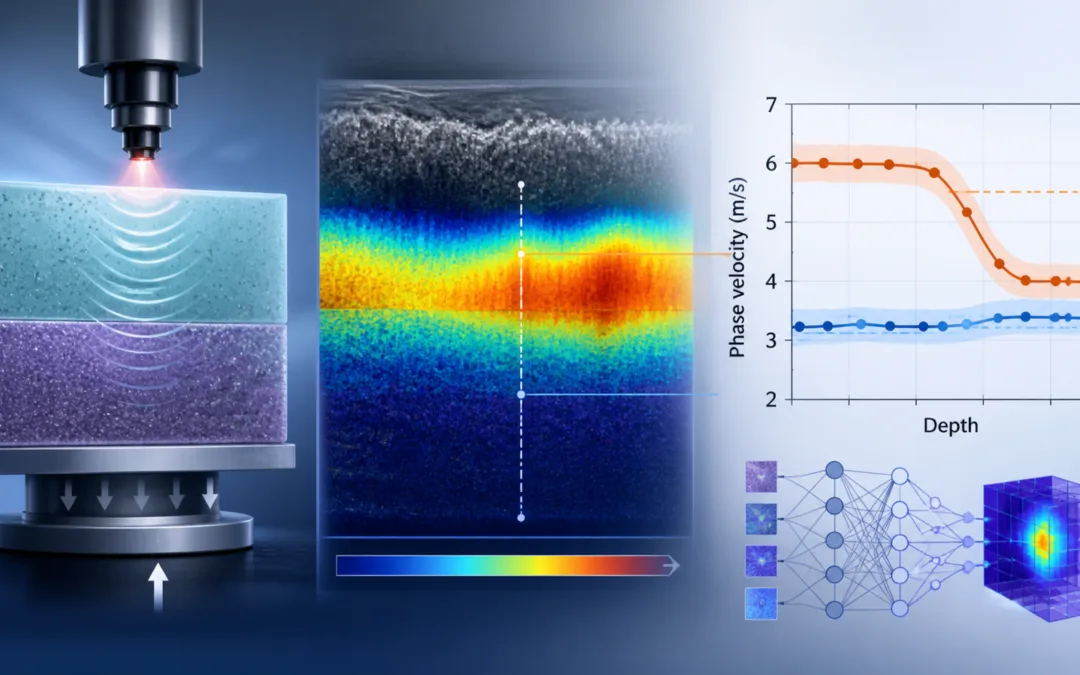
A recent study in Biomedical Optics Express explored this problem using surface acoustic wave optical coherence elastography, agar tissue phantoms, in vivo human skin measurements, and a deep learning model called PVNet. The UK-based authors developed a workflow for depth-resolved phase velocity estimation, then used mechanical compression testing with a CellScale UniVert S2 to validate the agar phantom measurements.
The UniVert was not the main subject of the paper, but its role was useful. It provided an independent mechanical test for the same agar batches used in the optical coherence elastography experiments. In practice, that made the compression data a check on whether the imaging and AI workflow was producing reasonable stiffness-related values.
Why AI-Based Elastography Measurements Need Mechanical Validation
Optical coherence elastography (OCE) measures how mechanical waves move through a sample. In this study, the authors used surface acoustic waves generated by a contact-based piezoelectric shaker. A swept-source OCT system then captured wave propagation through agar phantoms and skin.
The mechanical quantity being estimated was phase velocity. Phase velocity is not the same thing as Young’s modulus, but it is related to stiffness. In softer regions, waves tend to travel more slowly. In stiffer regions, they tend to move faster. That makes phase velocity useful for depth-resolved stiffness measurement, particularly when the goal is to identify changes between tissue layers.
The challenge is that conventional OCE processing can be computationally heavy. It often requires transformations between spatial-temporal and frequency-wavenumber domains, along with assumptions about the tissue or material. The authors proposed a two-part workflow. First, numerical spectral analysis was used to estimate phase velocity at specific depths. Then, a deep learning inversion model was trained to predict phase velocity from phase images.
That is where AI-based elastography measurements become both promising and tricky. A model can learn patterns in complex imaging data, but it still needs reliable reference values. For agar phantoms, the researchers addressed this by mechanically testing samples with the UniVert and comparing those results to the OCE-derived phase velocities.
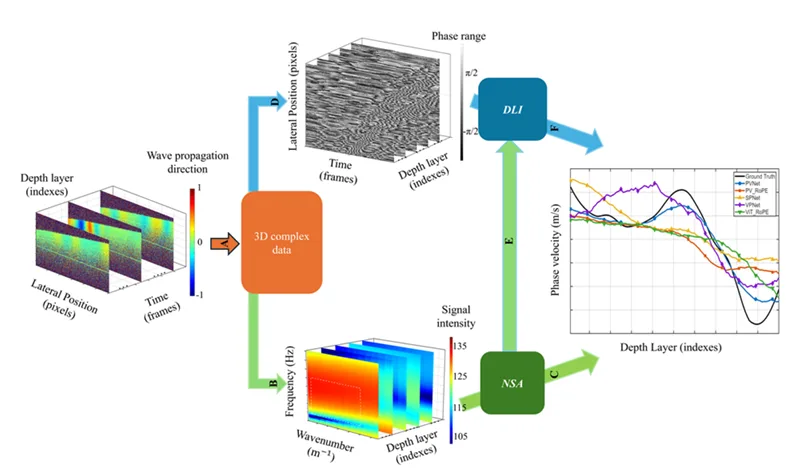
Processing workflow for depth-resolved phase velocity estimation. Panel A shows acquisition of 3D complex OCE data during surface acoustic wave propagation. Panel B shows transformation into the frequency domain by FFT after surface flattening. Panel C shows numerical spectral analysis for phase velocity estimation. Panel D shows extraction of phase images used as deep learning inversion inputs. Panel E shows training labels derived from numerical spectral analysis. Panel F shows depth-resolved phase velocity estimated by the deep learning model and compared with the numerical spectral analysis reference. Together, these steps show how AI-based elastography measurements were generated and compared against a numerical spectral analysis reference. Adapted from Zhang G. et al. Depth-resolved phase velocity estimation in layered tissue based on an efficient additive attention network with surface acoustic wave optical coherence elastography. Biomedical Optics Express. 2026.
Building Layered Tissue Phantoms for Depth-Resolved Stiffness Measurement
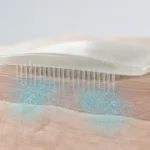
The experimental design used both homogeneous and layered agar phantoms. Homogeneous phantoms were made with agar concentrations from 1% to 5%, while the layered phantoms used a 2% agar top layer and a 1% agar lower layer. Titanium dioxide was added to improve optical scattering before gelation.
This tissue phantom testing step matters because the authors were not only asking whether the method could estimate a single stiffness value. They were asking whether the method could detect changes with depth.
That is a more difficult problem. In a layered sample, the wave behaviour near an interface may not be clean or abrupt. The signal can weaken with depth, and the apparent transition may be blurred by the spatial averaging used in the analysis. Still, these layered agar phantoms gave the authors a controlled system where they knew that one layer should behave differently from the other.
This use of agar phantoms also connects with our previous highlight on hydrogel stiffness measurement, where controlled mechanical testing helped relate material formulation to soft-tissue-like mechanical behaviour.
What the UniVert Measured in the Study
The authors used a UniVert (with S2 upgrade) in compression mode to characterize the agar phantoms. The agar samples used for mechanical testing were prepared from the same batches as the samples used in the optical coherence elastography experiments, which helped keep the comparison grounded in the same material preparation. In this context, compression testing helped anchor the AI-based elastography measurements to a physical material responses.
Before each measurement, the load cell was zeroed. The samples were then compressed using ramp displacement control. The total displacement was 1.5 mm, applied at a compression rate of 0.5 mm/s. Young’s modulus was calculated from the linear region of the stress-strain curve, using CellScale Data Analysis Software, and then converted to phase velocity based on prior work from the research group.
The UniVert measurements gave the authors an independent mechanical reference for the agar samples. The imaging workflow could then be checked against a value derived from physical force and displacement data, rather than judged only against internal model outputs.
For the homogeneous agar phantoms, the agreement was close. The 1% agar samples had an OCE-derived phase velocity of 3.8 ± 0.81 m/s, compared with 3.77 ± 0.30 m/s from mechanical testing. The 2% agar samples had an OCE-derived phase velocity of 6.46 ± 0.41 m/s, compared with 6.60 ± 0.56 m/s from mechanical testing.
Those values do not prove that every part of the workflow will translate directly to clinical measurements. Human skin is more complex than agar, and the authors note that in vivo measurements cannot be mechanically tested in the same way. But the agar results do provide a useful check. The AI-based elastography measurements were being developed against samples whose mechanical properties had also been measured by compression.
Detecting Mechanical Transitions in Layered Agar Phantoms
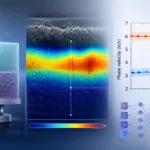
The layered phantom results are probably the clearest visual part of the study. In the phantoms with a 2% agar top layer and a 1% agar bottom layer, the authors looked for changes in phase velocity as a function of depth. They also compared the detected transition with the interface visible in B-scan images.
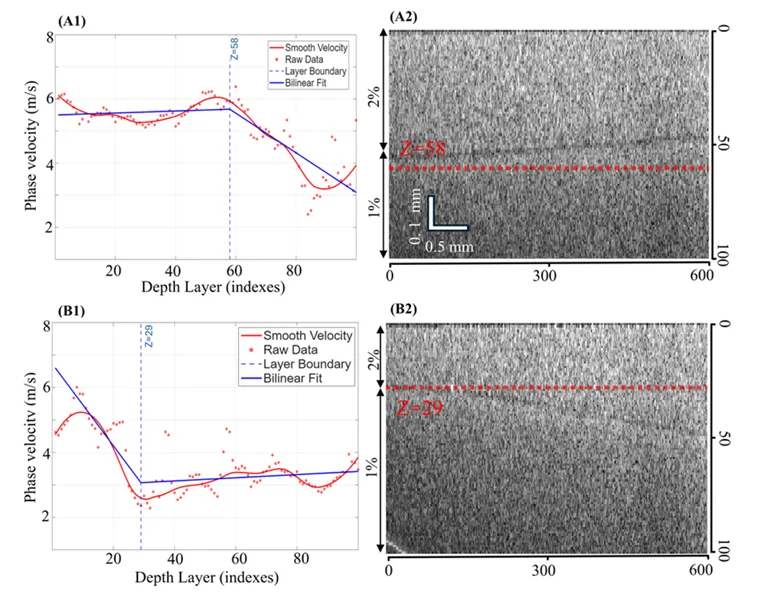
Numerical spectral analysis results for two-layer agar phantoms with a 2% agar top layer and 1% agar bottom layer. Panel A1 shows the phase velocity profile for a phantom with a thicker top layer, while panel A2 shows the corresponding B-scan image with the detected interface marked by a red dashed line. Panel B1 shows the phase velocity profile for a phantom with a thinner top layer, while panel B2 shows the corresponding B-scan image and estimated interface location. Adapted from Zhang G. et al. Depth-resolved phase velocity estimation in layered tissue based on an efficient additive attention network with surface acoustic wave optical coherence elastography. Biomedical Optics Express. 2026.
In one phantom with a thicker top layer, the phase velocity stayed near 5.5 m/s in the upper region, then dropped to about 3.1 m/s below the interface. The estimated transition occurred around depth index 58. In another phantom with a thinner top layer, the transition appeared around depth index 29, after which the velocity settled near 3.0 m/s.
This is a helpful example of depth-resolved stiffness measurement because the change is not just described in words. The profile bends where the material changes, and the B-scan image shows a corresponding physical interface. It gives the reader a way to see how phase velocity estimation can be used to track layered material behaviour.
For AI-based elastography measurements, this kind of layered phantom is useful because the expected mechanical transition is built into the sample.
Where the AI Model Fits in AI-Based Elastography Measurements
After using numerical spectral analysis to estimate phase velocity, the researchers trained deep learning inversion models to predict phase velocity from phase images. Their proposed model, PVNet, combined convolutional feature extraction with an efficient additive attention mechanism. The intention was to preserve local phase details while also capturing broader wave propagation patterns.
Several models were compared, including VPNet, SPNet, ViT-RoPE, PV-RoPE, and PVNet. Across the agar phantom tests, PVNet and PV-RoPE generally showed lower mean absolute error than the earlier models. In in vivo human skin, PVNet had the lowest overall error among the compared models, although palm measurements remained more difficult than the other anatomical sites.
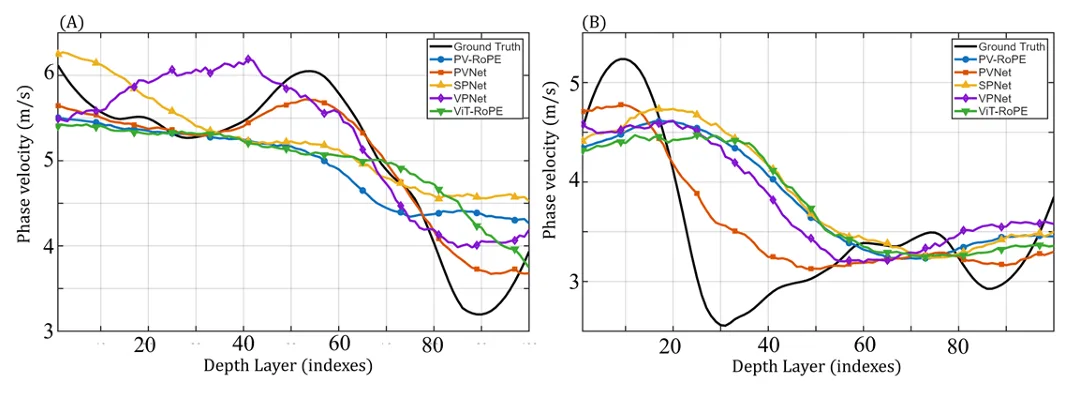
Depth-resolved phase velocity estimation for layered agar phantoms with a 2% agar top layer and 1% agar bottom layer. Panel A shows results for the phantom with a thicker top layer, while Panel B shows results for the phantom with a thinner top layer. In both panels, the numerical spectral analysis profile is used as the reference, and predictions from PVNet, PV-RoPE, SPNet, VPNet, and ViT-RoPE are shown for comparison. Adapted from Zhang G. et al. Depth-resolved phase velocity estimation in layered tissue based on an efficient additive attention network with surface acoustic wave optical coherence elastography. Biomedical Optics Express. 2026.
That palm result is worth noting. The authors did not present the method as a finished clinical tool that works equally well everywhere. The palm has thicker and more complex layered structure than some other skin sites, and all models performed worse there. That kind of limitation is useful in a research highlight because it keeps the story grounded. AI-based elastography measurements may be powerful, but tissue structure, signal quality, and layer thickness still affect performance.
The comparison also shows why AI-based elastography measurements still depend on carefully chosen reference data. For the layered phantoms, PVNet followed the numerical spectral analysis reference more closely than the other models. In the thinner top-layer phantom, most models struggled to reconstruct the depth-dependent velocity profile. PVNet still showed better agreement, though the result was not perfect.
Why This Matters for Skin Biomechanics and Tissue Mimetic Systems
The study also included in vivo human skin measurements from the forearm, palm, back of the hand, and face. Skin is layered, and mechanical behaviour can vary across the epidermis, dermis, and deeper tissue regions. Many skin conditions, lesions, and disease-related changes may influence local stiffness. The authors were interested in whether optical coherence elastography could estimate these depth-dependent differences without relying on invasive testing.
The measured phase velocity profiles differed by anatomical site. The palm and face showed higher average phase velocity values than the forearm and back of the hand. The detected interface depths also varied, with thicker epidermal regions such as the palm and back of the hand showing deeper interface estimates than thinner regions such as the forearm and face.
For people working in skin and wound healing biomechanics, organoid and tissue mimetic systems, or hydrogel mechanical testing, this kind of workflow is interesting because it sits between controlled bench testing and non-invasive imaging. The phantom work provides a physical basis for the analysis, while the skin measurements show where the approach might eventually be useful.
Mechanical Testing Has a Place Within AI in Biomechanics
One of the useful messages from this paper is that AI in biomechanics does not replace mechanical testing. Instead, mechanical testing often becomes part of the reference framework that makes imaging and modelling approaches easier to trust.
In this study, the UniVert compression tests did not generate the final in vivo skin measurements. They helped validate the agar phantom portion of the workflow. That is still meaningful. Tissue phantoms are often used as a bridge between simplified materials and biological tissues. If an optical or computational method cannot produce reasonable values in a controlled phantom, it is harder to interpret its behaviour in tissue.
The reverse is also true. Mechanical testing alone does not provide the spatial resolution or non-invasive access that OCE can offer. The value is in the combination. Compression testing gave a physical measurement of the agar samples. OCE provided depth-resolved wave data. Numerical spectral analysis generated phase velocity profiles. Deep learning was then used to estimate those values more efficiently from phase images.
That layered workflow is a good example of how AI-based elastography measurements are likely to develop in practice. The model sits inside an experimental system, and the experimental system still depends on careful materials, reference measurements, and interpretation.
Closing Thoughts
This publication is useful to study because it shows mechanical testing in a supporting role that is becoming more common. As imaging systems and deep learning models are used to estimate tissue mechanics, researchers still need controlled ways to check whether those estimates make sense.
Here, AI-based elastography measurements were developed using surface acoustic wave optical coherence elastography and deep learning inversion. Agar phantoms provided a controlled material system. UniVert compression testing supplied an independent mechanical reference. The comparison helped support the use of phase velocity estimation for layered tissue-like materials before moving into more complex in vivo skin measurements.
For CellScale readers, the broader point is not that every AI-based biomechanics study needs the same testing setup. It is that physical mechanical measurements remain part of the workflow, even when the final measurement method is optical, computational, or non-contact. For this reason, AI-based elastography measurements may be most useful when they are developed alongside well-controlled mechanical testing workflows.
What Is the UniVert?
The CellScale UniVert is a uniaxial mechanical testing system used to measure the mechanical properties of soft materials, biomaterials, tissues, gels, polymers, and other soft or elastic samples. Depending on the study design, it can be used for tests such as tension, compression, stress relaxation, cyclic loading, and other uniaxial protocols.
In this publication, the UniVert was used in compression mode to test agar phantoms. The researchers compressed the samples under controlled displacement, measured force response, calculated Young’s modulus from the stress-strain curve, and used those values as a mechanical reference for the OCE-derived phase velocity measurements.
That is a practical use case for the instrument. The UniVert was not used to replace the imaging method. It was used to ground it.