There are a lot of ways to record induced pluripotent stem cell (iPSC) cardiomyocytes, and multi-electrode array (MEA) plates are often the default. MEAs give a clean electrical trace and slot into safety pharmacology workflows people already use. The missing part is usually mechanical output. You can stare at a field potential trace for a long time and still not know whether the tissue is generating anything like a useful contraction.
In practice, an MEA contractility assay is less about inventing a new tissue model and more about keeping force and field potential in the same workflow.
If you want a broader tour of platform-style cardiac systems, we also covered another approach in our post on a new heart on a chip.
What an MEA contractility assay is trying to fix
A lot of engineered heart tissue work still ends up reporting either electrophysiology or force, but not both, and often not from the same sample. That can be fine if you are asking a narrow question. It gets uncomfortable when you care about excitation-contraction coupling and you are forced to infer mechanical function from electrical timing.
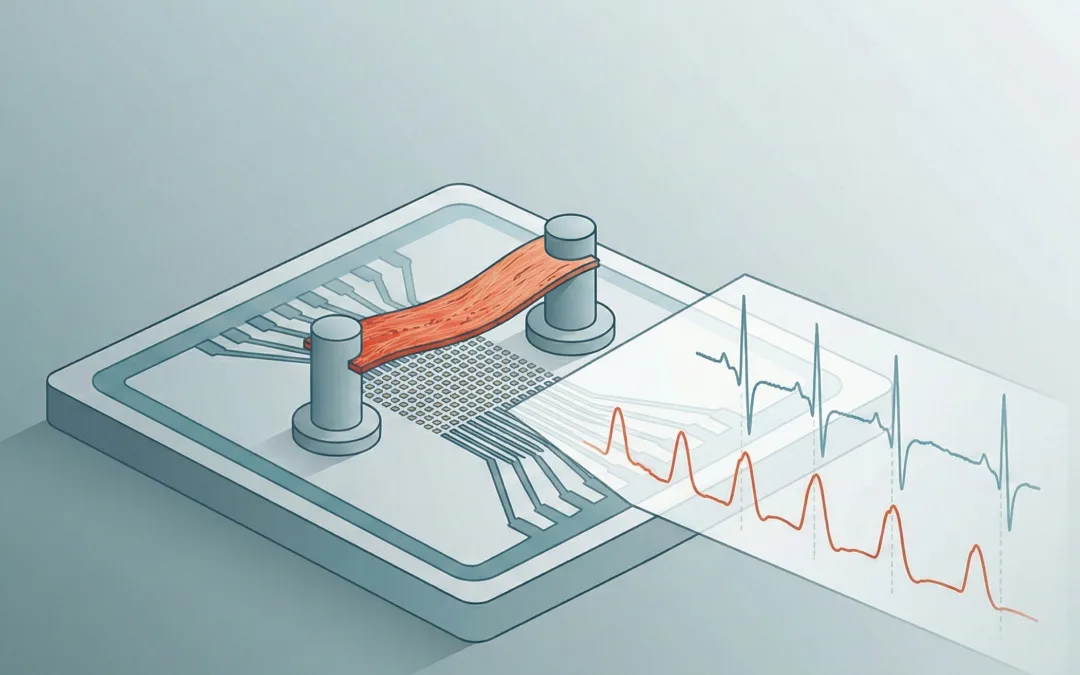
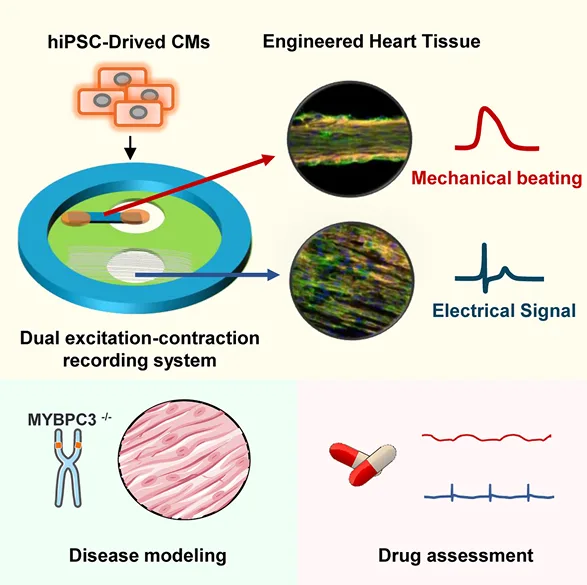
In this study, the authors built a setup that sits on a commercial MEA to collect field potentials while also reading contractility by tracking the motion of a compliant PDMS strip. So instead of treating force as a separate endpoint, they treat it as a second channel that runs alongside the electrical recording.
This is still, at its core, engineered heart tissue contractility measurement, but it’s engineered around the MEA workflow rather than bolting an MEA onto a force rig after the fact.
Hydrogel-free engineered heart tissue contractility measurement on an MEA
A second thing that shapes the whole paper is the tissue format. The constructs are described as hydrogel-free engineered heart tissue, built on an aligned electrospun PLGA fiber scaffold. That alignment gives the cardiomyocytes a direction to organize against, which matters if you want a contraction that looks like something other than a noisy twitch.
The tissue doesn’t start as a neat 3D bundle. It begins as a seeded layer and then, over days, detaches from part of the PDMS surface and transitions into a thicker construct anchored elsewhere. If you’ve worked in cardiac tissue engineering or with cardiac constructs that compact and self-organize around anchors, it looks familiar. Here it is happening inside a device that can still be placed on an MEA.
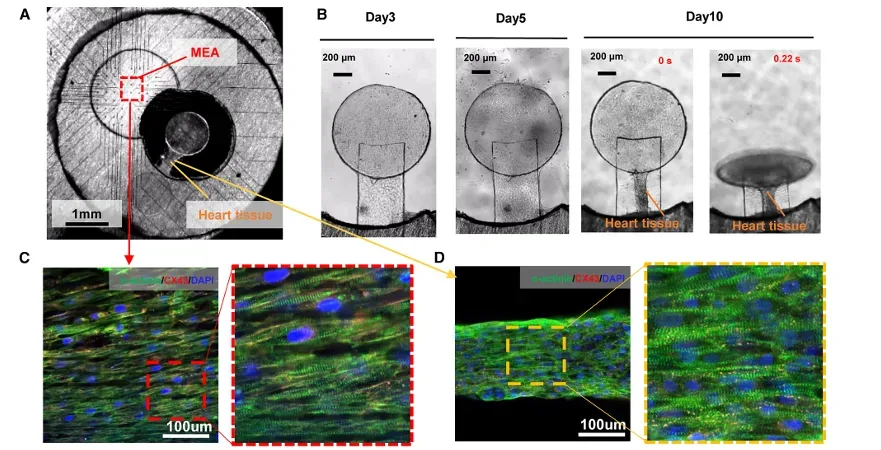
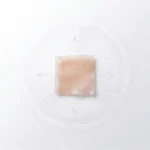
MEA contractility assay in action: the device on an MEA, the tissue forming, and the paired traces. Panel (A) shows the tissue positioned within the device over an MEA region. Panel (B) shows tissue formation over time (Day 3 to Day 10). Panels (C–D) show aligned cardiomyocyte structure and connexin staining in the fiber/tissue region. Adapted from Li, Junjun et al. Cell Reports Physical Science, Volume 7, Issue 1, 103068.
How the DEC chip turns an MEA into an MEA contractility assay
The device itself is a holder that interfaces with an MEA while also carrying a flexible PDMS strip that serves as the mechanical readout element. The layers are not complicated in concept: a PDMS holder, discs for support, the aligned PLGA fiber region for cells, and the PDMS strip positioned so that tissue contraction deflects it.
One practical point is that the authors designed it so the chip can be removed and placed again, which matters when you’re working with MEAs that you want to reuse. You can almost see the intended workflow: record field potentials, move to imaging or culture steps, come back, and keep collecting paired signals.
The paper isn’t claiming to measure everything. It’s simultaneous electrophysiology and contraction measurement; trying to keep the two signals together so you’re not stitching conclusions across separate experiments.
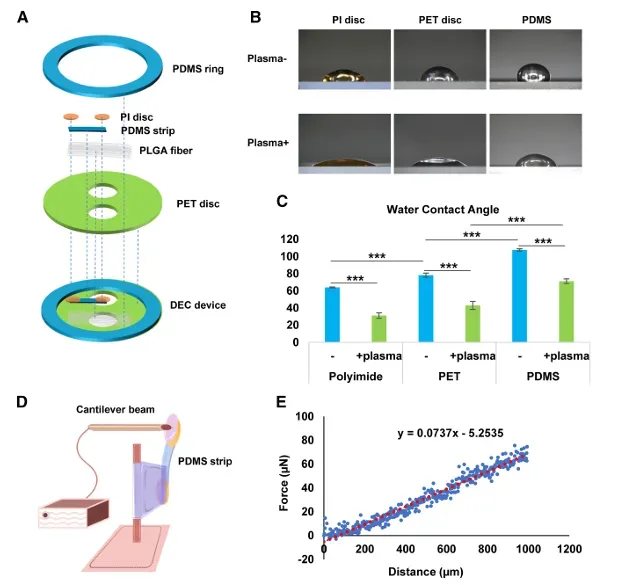
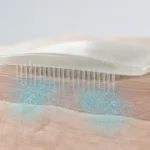
Dual excitation-contraction (DEC) chip layout and force calibration approach. Panel (A) shows the device stack (PDMS holder, PI disc, PDMS strip sensor, aligned PLGA fiber scaffold, PET disc). Panels (D–E) illustrate how force is estimated from PDMS strip deflection using a cantilever-style calibration and a force–displacement relationship. Adapted from Li, Junjun et al. Cell Reports Physical Science, Volume 7, Issue 1, 103068.
MicroTester use in the study: calibrating the PDMS strip force response
This is the part of the paper that quietly supports everything else. The contractility channel is derived from PDMS strip deflection. That means the reliability of the output depends on how well you understand the strip’s force-displacement behaviour.
The authors validated force measurements using a CellScale MicroTester. In practice, that kind of calibration step is where “iPSC cardiomyocyte force measurement” either becomes a real measurement or stays in the category of “movement we can track.”
PDMS looks simple, but small differences in geometry, curing, bonding, and constraint can change effective stiffness. When the PDMS strip is your sensing element, those details can leak into your biology results unless you check them. A micro-mechanical tester lets you apply controlled deformation and measure the corresponding force so you can build the mapping that turns strip motion into a contractility signal you can compare across devices.
This isn’t glamorous, but it is often the difference between a platform that works in one lab and a platform that produces interpretable force numbers when the design gets replicated.
Excitation-contraction coupling engineered heart tissue: why the second channel changes interpretation
Once the device is running, the paper starts to read like a series of cases where electrical and mechanical outputs do not track each other cleanly. That’s not a surprise if you’ve spent time with cardiomyocyte cultures, but it can be easy to forget when you’re only looking at one trace.
This is also where excitation-contraction coupling in engineered heart tissue stops sounding abstract. The point of collecting both channels isn’t to make a prettier figure. It’s to see when electrical stability doesn’t guarantee mechanical output, or when changes in field potential duration happen alongside a drop in contraction amplitude.
If you search online “how to measure contractility in engineered heart tissue” you’ll find a lot of endpoints. What’s different here is the insistence that force-related information stays paired with the MEA readout, rather than becoming a separate assay.
Drug testing on an MEA contractility assay: when force and field potential diverge
The authors use a drug panel that spans torsade de pointes risk categories. They record mechanical beating and field potentials as doses increase. Some compounds shift the electrical metrics without dramatic force changes. Others show the opposite. The more interesting moments are when arrhythmic features appear in the electrical trace while the contractility signal becomes irregular or collapses.
Even if you don’t care about the specific compounds, the format is useful: it’s a paired readout that makes it harder to overinterpret either channel. An MEA trace can look orderly while force fades. A force trace can look stable while electrical timing drifts.
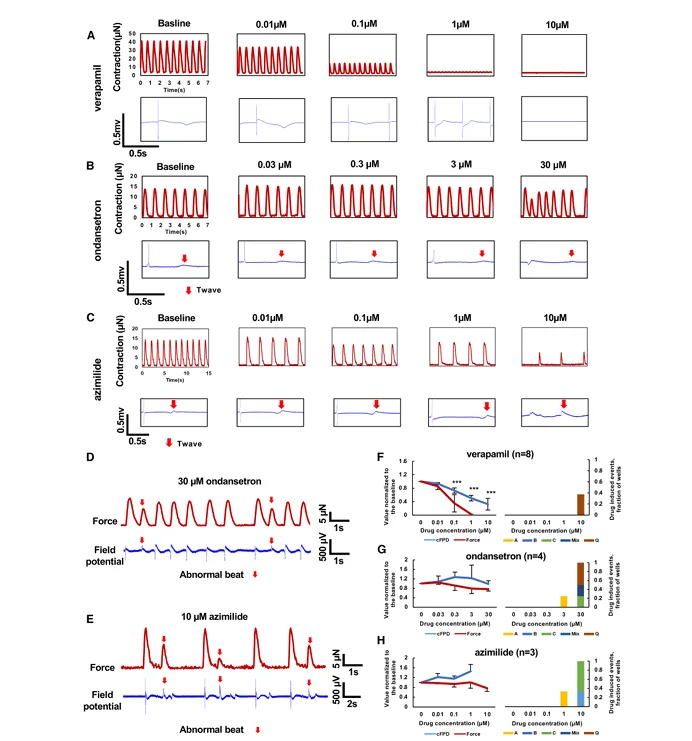
Drug-response examples where electrical and mechanical readouts diverge. Panels (A–C) show paired contraction traces and field potential traces across increasing doses for different compounds. Panels (D–E) show examples of abnormal beats (marked) observed after ondansetron and azimilide, alongside the contraction signal. Panels (F–H) summarize normalized changes in corrected field potential duration (cFPD) and force across doses. Adapted from Li, Junjun et al. Cell Reports Physical Science, Volume 7, Issue 1, 103068.
Contractile force looks different depending on the scale you measure it at, which we touched on in a separate post on multi-scale left ventricle contractile forces.
iPSC cardiomyocyte force measurement in a disease model: MYBPC3 tissues under pacing
The disease modeling section focuses on MYBPC3 genotypes (WT, heterozygous, homozygous). What stands out is that corrected field potential duration does not separate the groups in a dramatic way, at least not in the way you might hope if you were trying to call phenotype from electrophysiology alone.
Before getting into the force and pacing traces, the authors spend a bit of time showing what these tissues actually look like on the device. In the figure below, they lay out the workflow from patient-derived iPSCs and gene editing through cardiomyocyte differentiation and tissue formation on the DEC chip. The staining panels are a useful reminder that the construct isn’t uniform across the whole footprint. It’s not proof that everything is perfectly controlled, but it does help anchor the functional readouts in some visible tissue organization rather than just traces on a plot.
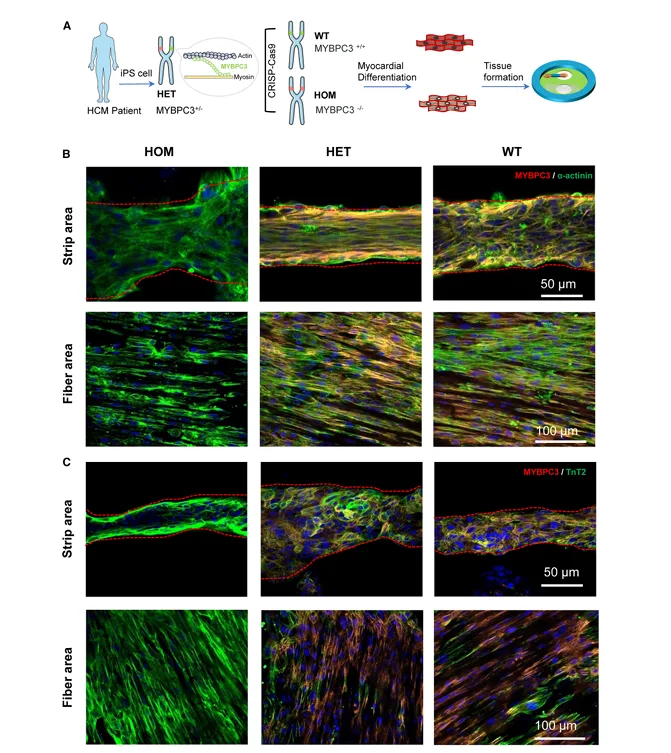
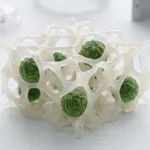
Engineered tissues used for MYBPC3 disease modeling and their organization on the DEC chip. Panel (A) outlines the workflow from iPSCs and gene editing to myocardial differentiation and tissue formation on the device. Panels (B–C) show immunostaining images in the strip area and fiber area for HOM, HET, and WT tissues, indicating differences in tissue morphology and marker distribution across regions. Adapted from Li, Junjun et al. Cell Reports Physical Science, Volume 7, Issue 1, 103068.
The contractile force readout is more informative. Differences show up in force metrics and, importantly, in how the tissues respond when pacing frequency is ramped upward. That pacing protocol exposes tolerance limits that don’t always show up in spontaneous beating. It also feels like the kind of stress test people actually want when they’re trying to model disease rather than simply confirm that cells beat.
This is one of those cases where a dual readout seems less like extra instrumentation and more like basic hygiene. If the phenotype is mechanical first, you want a mechanical channel present from the start.
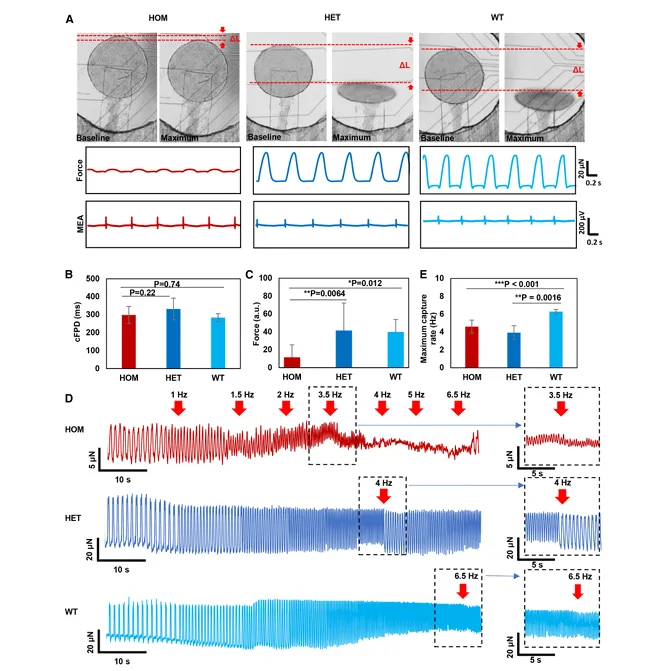
MYBPC3 disease modeling with simultaneous electrophysiology and contractile force. Panel (A) shows example images of PDMS strip displacement alongside representative force and MEA traces for HOM, HET, and WT tissues. Panels (B–C) compare corrected field potential duration (cFPD) and force across genotypes. Panel (D) shows pacing escalation traces, with panels (E) and the right-side insets highlighting genotype-dependent differences in maximum pacing response. Adapted from Li, Junjun et al. Cell Reports Physical Science, Volume 7, Issue 1, 103068.
We’ve also written more broadly about cardiac tissue disease modeling, especially when mechanical phenotype is the part that shows up first.
What this MEA contractility assay approach still leaves open
The paper is fairly direct about the tradeoffs. The mechanical readout comes from optical tracking of a compliant PDMS element. That can be a strength because it’s accessible and doesn’t require embedded electronics, but it also means imaging and analysis can become a bottleneck. And if you care about absolute force values, calibration and fabrication consistency start to matter a lot.
None of that makes the approach less useful. It just puts it in the category of platforms that work well when the mechanical side is treated as a real measurement, not a decorative overlay on the MEA trace. That’s why the MicroTester calibration step is not a side detail in this story.
Citation
About the MicroTester
The MicroTester is a micro-mechanical testing system used to apply controlled compression, indentation, bending, viscoelastic, and shear testing to small and compliant samples, including soft polymers and elastomeric components used in bioassays. In studies like this one, it often shows up as a calibration tool: characterizing the force-displacement response of flexible elements (like PDMS strips) so that optical motion can be interpreted as a mechanical output rather than an unscaled displacement signal.
If you are building an assay where a soft component acts as the sensing element, or you are trying to validate iPSC cardiomyocyte force measurement workflows with a real force reference, the MicroTester is typically used upstream of the biology experiment to quantify stiffness and mechanical response under controlled conditions.